Article Written By Casey Harper at The Center Square-
(The Center Square) – Newly released inflation data breaks down how much prices have increased in each state.
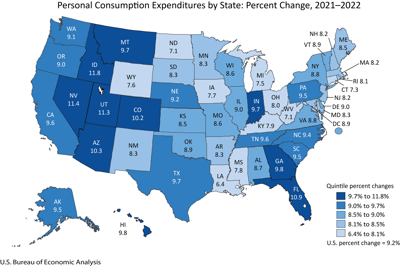
The U.S. Bureau of Economic Analysis released new data Wednesday for how the Personal Consumption Expenditure, a key marker of inflation, rose in each state last year. According to the BEA, PCE is a measure of the prices Americans pay for goods and services.
“Nationally, personal consumption expenditures (PCE), in current dollars, increased 9.2 percent in 2022 after increasing 12.9 percent in 2021. PCE increased in all 50 states and the District of Columbia, with the percent change ranging from 11.8 percent in Idaho to 6.4 percent in Louisiana…”
Prices have continued to rise in 2023, though at a significantly lower rate until August, when prices spiked again.
The price increases in 2022 varied by state:
Prices have soared in recent years, in large part because of a spike in federal debt spending, which facilitates an increase in the money supply.
“Expenditures on housing and utilities, food services and accommodations, and health care were the largest contributors to the increase nationally…” BEA said.
Notably, housing and utility costs rose 7.9% nationally, and was the biggest increase in 29 states and Washington, D.C.
“Food services and accommodations increased 17.6 percent nationally and was the largest contributor to increases in seven states,” BEA said. “Health care increased 5.6 percent nationally and was the largest contributor to increases in nine states.”